In 2021, Brazil had a good recovery in import numbers, with a growth of 38.2% compared to 2020, totaling US$ 219 million. Its main partners were China, with a 21.8% share of the total origin of imports, and the United States with 18%.
Last week we talked a little about exports, but today on Modal’s blog, we’ll show you a little more about what imports are and the results Brazil has had in the last year.
You will see in this post:
- What is import?
- 10 states that matter most
- 10 biggest import partners
- Most imported products
What is import?
Import is the process of purchasing and/or receiving products, goods or services between countries. It is the entry of foreign products or services into national territory.
Generally, a country is not self-sufficient in all sectors of the economy, so it is necessary to import products or services, which supply industrial sectors with raw materials, enable research and also supply the population with food.
States that matter most
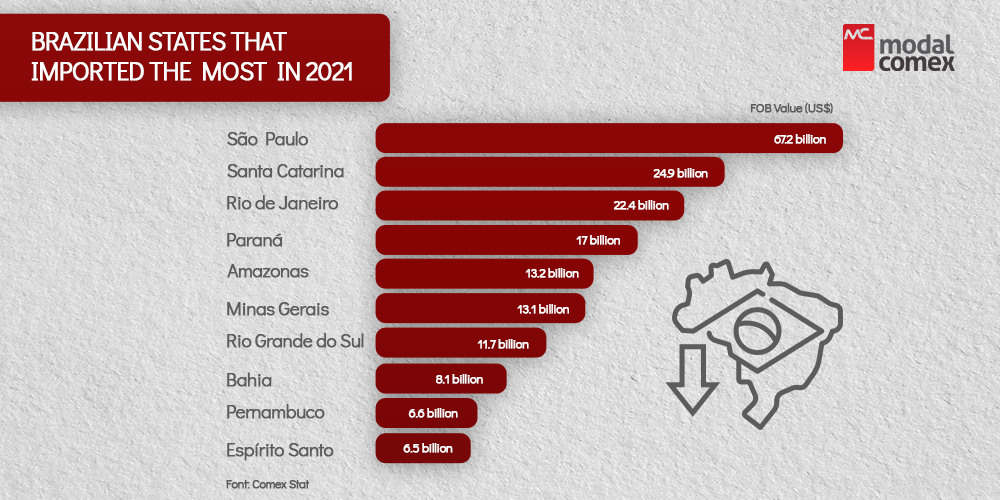
The state that stood out in terms of imports in 2021 was São Paulo, with a 30.6% share in the country’s imports, totaling US$ 67 billion (FOB).
The list below will show you the top 10 states that mattered the most in 2021:
- São Paulo – FOB value US$ 67.2 billion – 30.6% share
- Santa Catarina – FOB value US$ 24.9 billion – 11.4% share
- Rio de Janeiro – FOB value US$ 22.4 billion – 10.2% share
- Paraná – FOB value US$ 17 billion – 7.74% share
- Amazonas – FOB value US$ 13.2 billion – 6.028% share
- Minas Gerais – FOB value US$ 13.1 billion – 5.95% share
- Rio Grande do Sul – FOB value US$ 11.7 billion – 5.35% share
- Bahia – FOB value US$ 8.1 billion – 3.67% share
- Pernambuco – FOB value US$ 6.6 billion – 3.026% share
- Espírito Santo – FOB value US$ 6.5 billion – 2.97% share
Origin of imports
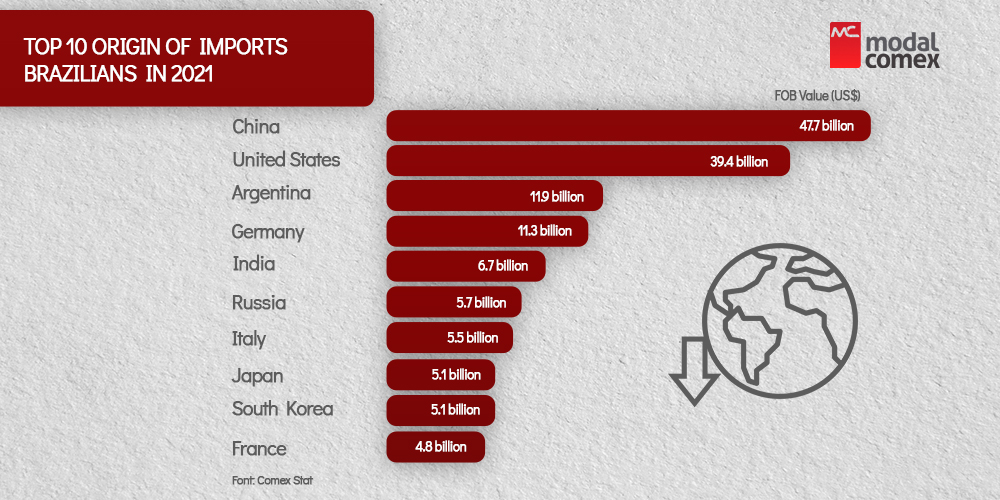
China and the United States are Brazil’s largest economic partners in imports, together they hold a 39.8% share of the country’s imports, with China with 21.8% and the United States with 18%, totaling a FOB value of US$ 87. .1 billion.
The list below will show you the top 10 countries of origin of imports in 2021:
- China – FOB value US$ 47.7 billion – 21.8% share
- United States – FOB value US$ 39.4 billion – 18% share
- Argentina – FOB value US$ 11.9 billion – 5.45% share
- Germany – FOB value US$ 11.3 billion – 5.18% share
- India – FOB value US$ 6.7 billion – 3.071% share
- Russia – FOB value US$ 5.7 billion – 2.60% share
- Italy – FOB value 5.5 billion – 2.5% share
- Japan – FOB value US$ 5.1 billion – 2.35% share
- South Korea – FOB value US$ 5.1 billion – 2.33% share
- France – FOB value US$ 4.8 billion – 2.2% share
Most imported products
Brazil has an extensive list of imported products, but the most prominent sector is the manufacturing industry, with fertilizers or chemical fertilizers as the most imported products in 2021.
Brazil divides its imports into 4 sectors, namely: Transformation Industry, which dominated 90% of imports, Extractive Industry appears shortly after with 5.92%, Agriculture with 2.44% and Other Products with 1.66%
Below I will present the 3 most imported products by each economic activity:
Transformation Industry
- Fertilizers or Chemical Fertilizers – Value FOB US$ 15.1 billion – Participation in the sector 7.7% – General participation 6.9%;
- Petroleum or bituminous mineral fuel oils – FOB value US$ 13.4 billion – Sector share 6.8% – Overall share 6.1%
- Other products – Manufacturing Industry – Value FOB US$ 9.6 billion – Participation in the sector 4.9% – General participation 4.4%
Extractive Industry
- Natural gas – FOB value US$ 4.7 billion – Industry share 36% – General share 2.2%
- Crude petroleum oils or crude bituminous minerals – FOB value US$ 4 billion – Sector share 31% – Overall share 1.8%
- Coal, even in powder form, but not agglomerated – FOB value US$ 2.8 billion – Industry share 21% – Overall share 1.3%
Agriculture
- Wheat and rye, unmilled – FOB value US$ 1.67 billion – Sector share 31% – Overall share 0.76%
- Unground corn, except sweet corn – FOB value US$ 734 million – Sector share 14% – General share 0.33%
- Live, dead or chilled whole fish – FOB value US$ 611 million – Industry share 11% – Overall share 0.28%
Too many products
- Electric energy – FOB value US$ 2.9 billion – Sector share 79% – General share 1.3%
- Waste from non-ferrous base metals and scrap – FOB value US$ 428 million – Industry share 12% – General share 0.20%
- Printed material – FOB value US$ 132 million – Industry share 3.6% – General share 0.060%